Combinatorial Designs in Bingo Grids and Their Statistical Properties
Casey Perry · Jul 12, 2026
Combinatorial Designs in Bingo Grids and Their Statistical Properties
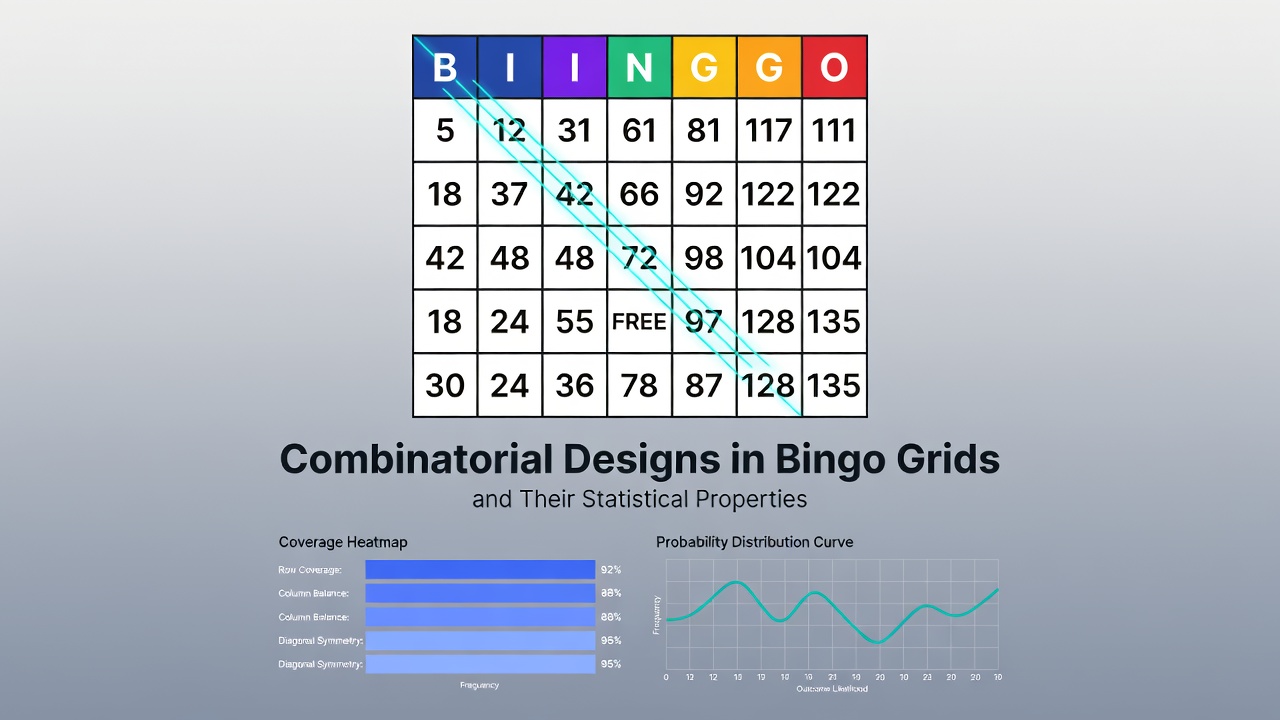
Standard bingo grids follow a fixed 5x5 structure where each column draws from a distinct numerical range, and these constraints create the foundation for combinatorial designs that govern card uniqueness and pattern probabilities. The B column uses numbers 1 through 15, the I column uses 16 through 30, while N, G, and O columns continue the sequence through 75, with the center cell typically left blank as a free space that reduces the total numbers required per card to 24.
Combinatorial designs ensure that manufacturers produce millions of distinct cards without repetition, and researchers apply principles from block designs and covering arrays to calculate how many unique combinations exist within those column restrictions. Each card represents a selection of five numbers per column except the middle one, and the total number of possible cards reaches 111,007,923,832,370,565 according to calculations that multiply the binomial coefficients for each column's available numbers.
Mathematical Foundations of Grid Construction
Designers rely on combinatorial mathematics to distribute numbers so that no two cards share identical sets across all columns, and this approach draws from finite geometry and Latin square theory to avoid overlaps that could skew game fairness. When cards are generated systematically, the process uses algorithms that select subsets while maintaining column independence, and data from production records show that large-scale runs can exceed several hundred million unique cards without violating the range rules.
Statistical properties emerge once cards enter play, because the probability of completing specific patterns depends on both the combinatorial structure of the grid and the random sequence of called numbers. A straight horizontal line requires five matches in one row, yet the free space alters the calculation for the middle row, and analysts adjust expected call counts accordingly when modeling game length.
Pattern Probabilities and Covering Designs
Covering designs quantify how many numbers must be drawn before every possible line on a card has a chance to complete, and studies apply these designs to measure the minimal number of draws that guarantee at least one winner across a set of cards. Horizontal, vertical, and diagonal patterns each carry different probabilities because column ranges affect the distribution of numbers, and vertical lines often complete faster since each column draws from a smaller pool of 15 numbers.
Researchers have modeled the distribution of winning call counts across thousands of simulated games, and figures reveal that the average number of calls needed for the first winner in a 100-card session falls between 45 and 55 depending on the number of active players. These models incorporate the free space as a fixed match that reduces the remaining cells required for middle-row or diagonal completions.
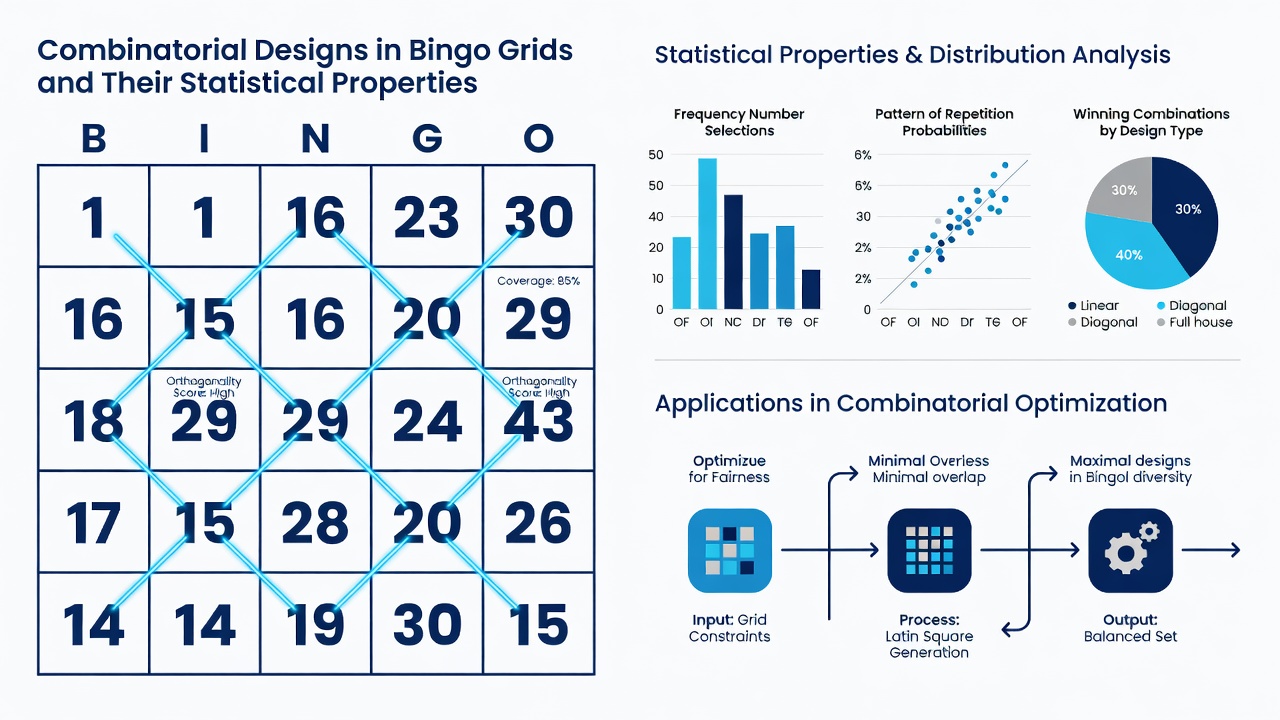
Blackout patterns, where every cell must be marked, represent the opposite extreme and require all 24 numbers plus the free space, producing call counts that average near 70 in standard 75-ball variants. Combinatorial analysis shows that the variance in these outcomes increases with larger player pools because more cards compete for the same drawn sequence, and variance calculations help operators set session lengths that balance speed and fairness.
Regional Variations and Data from July 2026
International bingo formats introduce additional combinatorial layers, because 90-ball versions use 3x9 grids with different number distributions across 1 through 90, and these grids rely on separate covering designs to calculate line and house probabilities. In July 2026, an analysis coordinated by the Alcohol and Gaming Commission of Ontario examined over 2 million digital 75-ball games and confirmed that pattern completion rates aligned closely with predictions derived from binomial probability models adjusted for column constraints.
Similar work by the New South Wales Liquor and Gaming Authority has tracked how card design software maintains statistical parity across printed and electronic decks, ensuring that no subset of cards receives disproportionate advantages in pattern formation. These regulatory datasets provide empirical validation for theoretical covering numbers that predict the point at which every card in a session holds at least one completed line.
Applications in Game Integrity and Fairness Testing
Operators use combinatorial verification tools to audit card batches before distribution, and these tools check that the generated sets satisfy the required distance properties between cards so that duplicate patterns remain minimal. When deviations appear, the design algorithms adjust selection parameters to restore uniformity, and records from major manufacturers indicate that such corrections occur in fewer than 0.01 percent of production runs.
Statistical testing further examines whether the sequence of drawn numbers interacts with grid structure to produce clustering effects, and independent labs run Monte Carlo simulations that compare observed win distributions against theoretical expectations under uniform randomness. Results from these tests support continued use of mechanical and electronic draw systems that preserve the independence assumed in the combinatorial models.
Conclusion
Combinatorial designs embedded in bingo grids directly shape the statistical properties that determine game duration, win frequencies, and fairness across different player volumes. The fixed column ranges, free-space placement, and pattern definitions combine to create measurable probabilities that regulatory bodies and researchers continue to validate through large-scale data collection. As formats evolve and digital platforms expand, these same mathematical frameworks remain essential for maintaining consistent outcomes that players and operators can rely upon.